
Oil-Paint Filter
I love to play with images. The effect shown in the animation (on right) is called Oil-Paint effect. Though there are numerous softwares and plugins available which use different algorithms to achieve this oil-painting effect, I have developed this particular algorithm on my own following my intuitions. Other commonly known algorithms (probably better & efficient as well) are shown in ‘similar algorithms’ section below.
The basic idea is to somehow digitally imitate the strokes of a brush used by a painter. Generally oil-painters do not give too much attention to the fine details in their paintings (in most regions). The lack of very high details is inherent following the process of oil-painting. More details and examples of oil-painting can be found on wikipedia page.
Contrary to oil-paintings, digital images captured by digital cameras have very fine details, pertaining to highly sensitive CCD or CMOS image sensors. So, basically high details have to be removed to achieve the oil-paint effect. One way to achieve this is to approximate small regions of image with a color or intensity, which represents the region best estimate. Thus the resulting image will have patches of regions with same color or intensity. To remove even more details, size of the region can be increased. Another less intuitive method, to remove more details, can be to decrease the depth (intensity levels) of the image and re-sample the image in lower depth. I have combined both the methods to get better results.
Details
For each pixel of input image, a region of radius r is taken and a representative color/intensity is calculated for that region. This representative value corresponds the color/intensity value of the corresponding pixel of final output image. In order to calculate the representative value, the image is first down-sampled to, say, L levels. Colored images are first converted to greyscale for processing. Next, most frequent occurring intensity, in the specified region of down-sampled image, is calculated. The original intensity level corresponding this most frequent occurring down-sampled intensity gives the representative intensity of the region. For color images, the original R,G,B values are the representative color. The same method is repeated for each pixel of the image. Changing the value of radius r and number of intensity levels L gives different levels of oil-painted image.
The explained algorithms is implemented in matlab: source code file
Some results are shown below.
 |
 |
 |
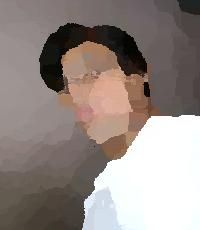 |
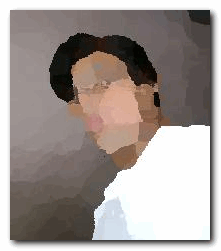
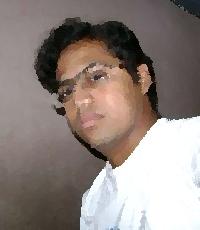
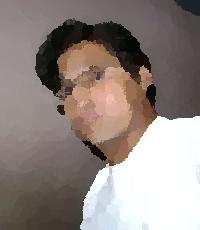
| Original Image | r = 1, L = 70 | r = 5, L = 130 | r = 10 , L = 130 |
Different output images, corresponding to different values of r and L, were joined to form the above animation. FastStone Image Viewer was used to join the images to form an animated gif. Another example is given below. Note the absence of details in the processed image.
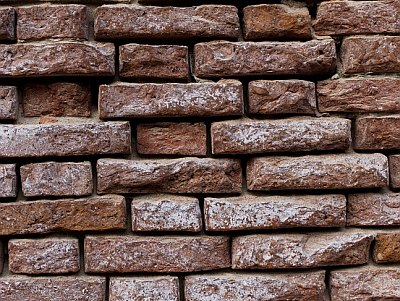 |
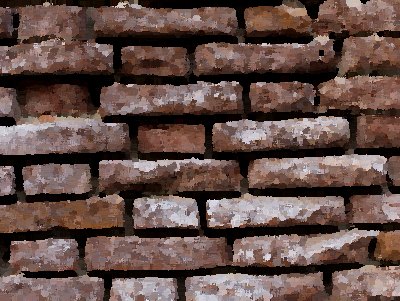 |
| Original Image | After Processing, r = 3, L = 20 |
Similar Algorithms
- Hertzmann, A., Painterly rendering with curved brush strokes of multiple sizes. In: Proceedings of SIGGRAPH, pp. 453–460 (1998)
- Oilify Artistic Filter in Gimp
- Painterly Rendering